Articles6 min read

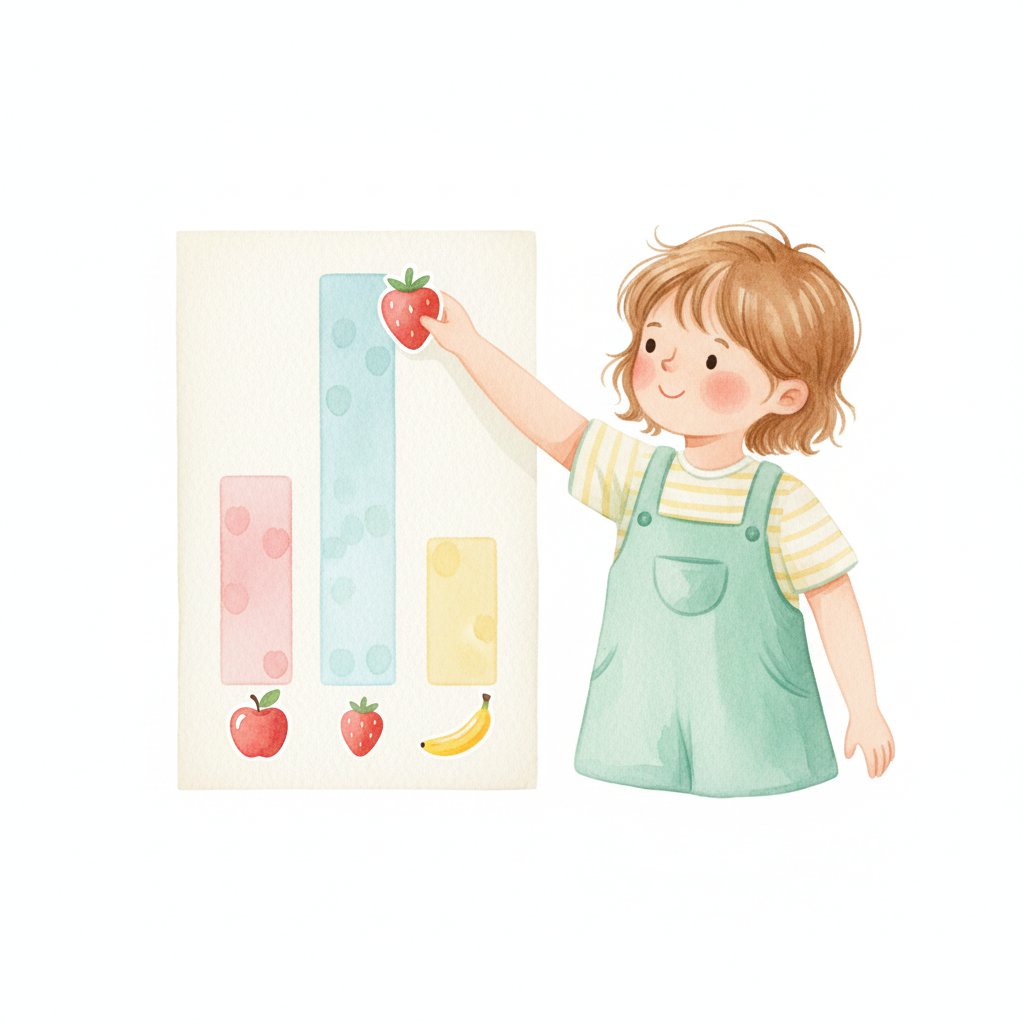
The Snack Graph That Started a Conversation

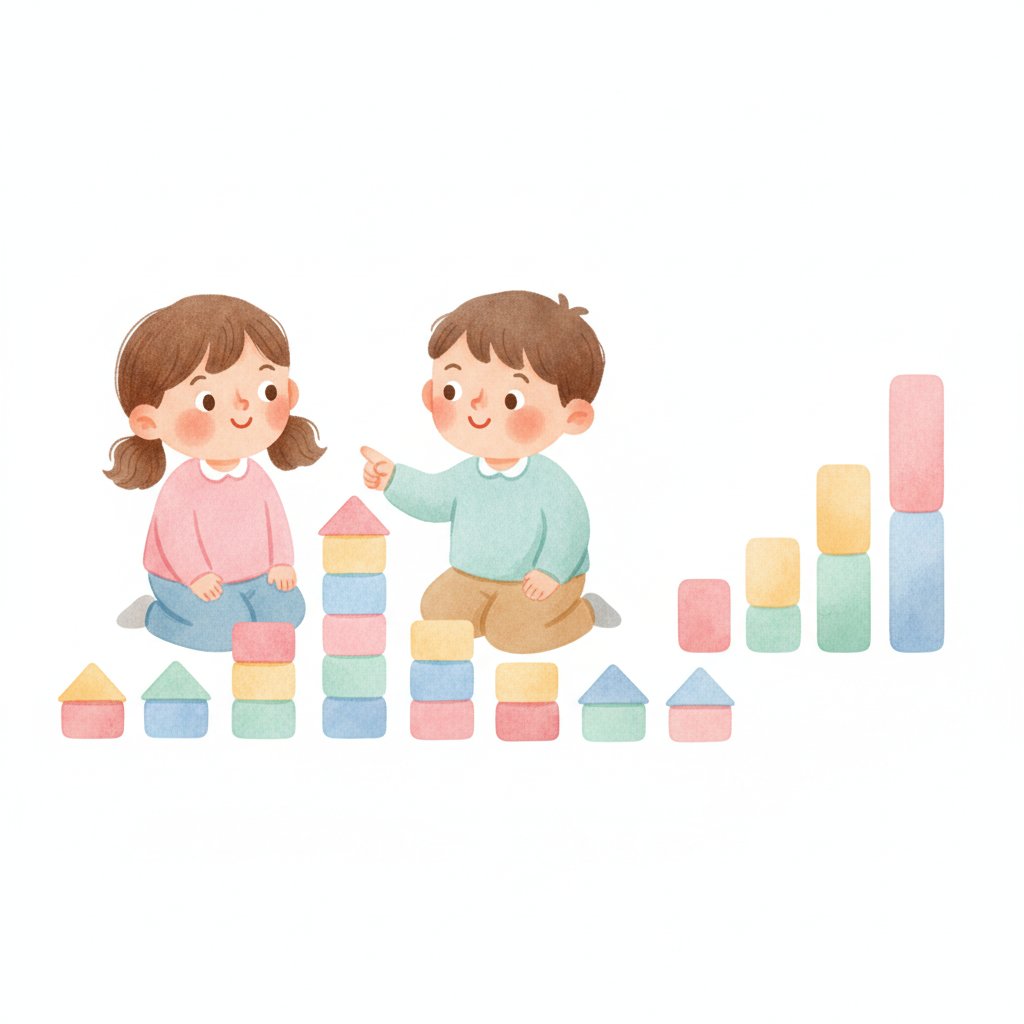
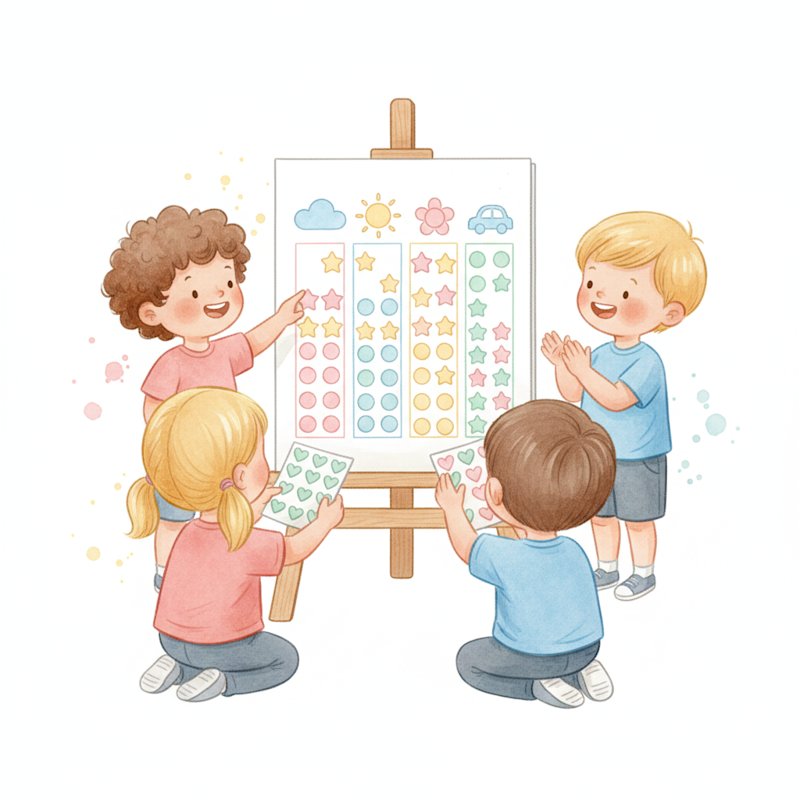
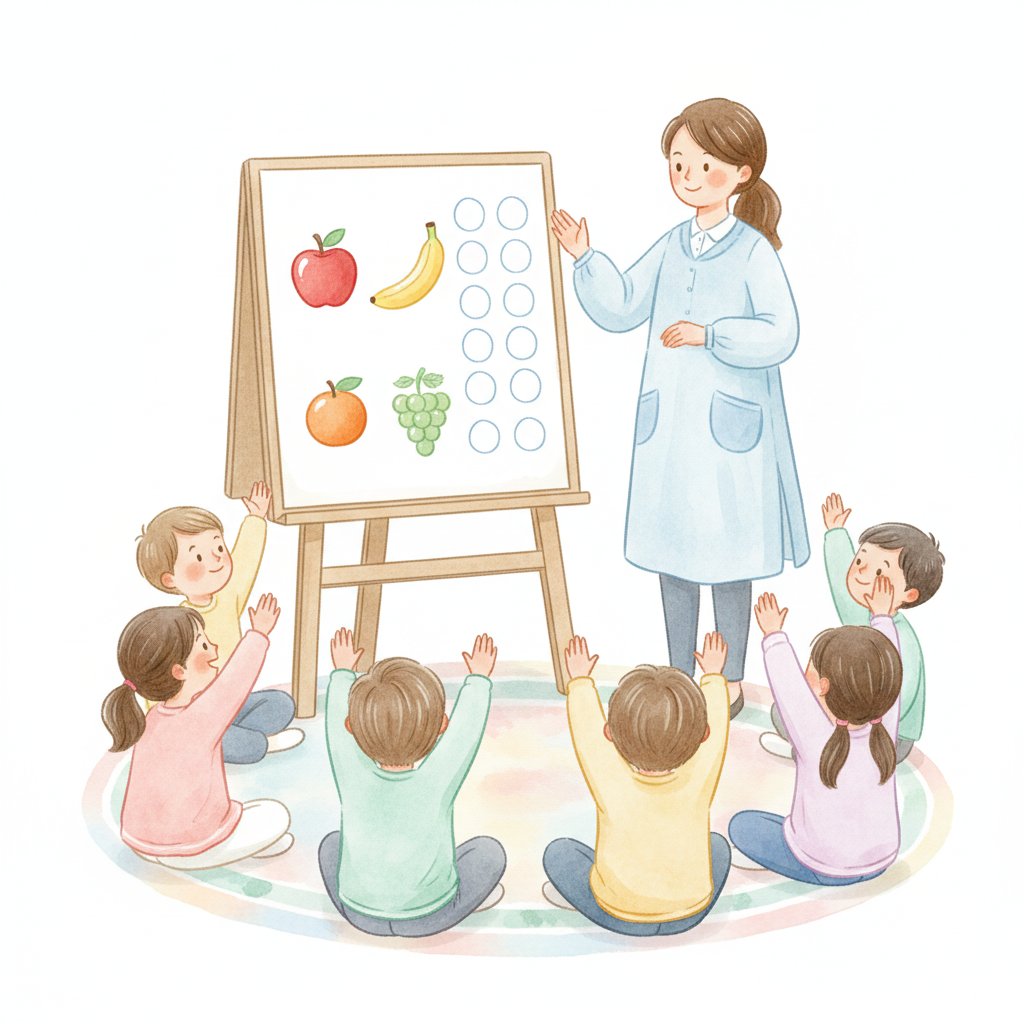
"Raise your hand if you like apples." Eight hands. "Bananas?" Six hands. "Grapes?" Ten hands. I drew three columns on chart paper and put a sticker for each hand. The children stared at the growing columns. "GRAPES has the most!" Leo shouted. "How do you know?" I asked. He pointed: "It's the TALLEST." Then Mia said, "Apples has MORE than bananas. I can see it goes higher." In that moment, seven four-year-olds understood that DATA tells a story, and GRAPHS are how you see it. They started graphing everything: favorite colors, shoe types, pets, eye color, how they got to school. Every graph started a CONVERSATION — because data without discussion is just marks on paper, but data WITH discussion is THINKING.

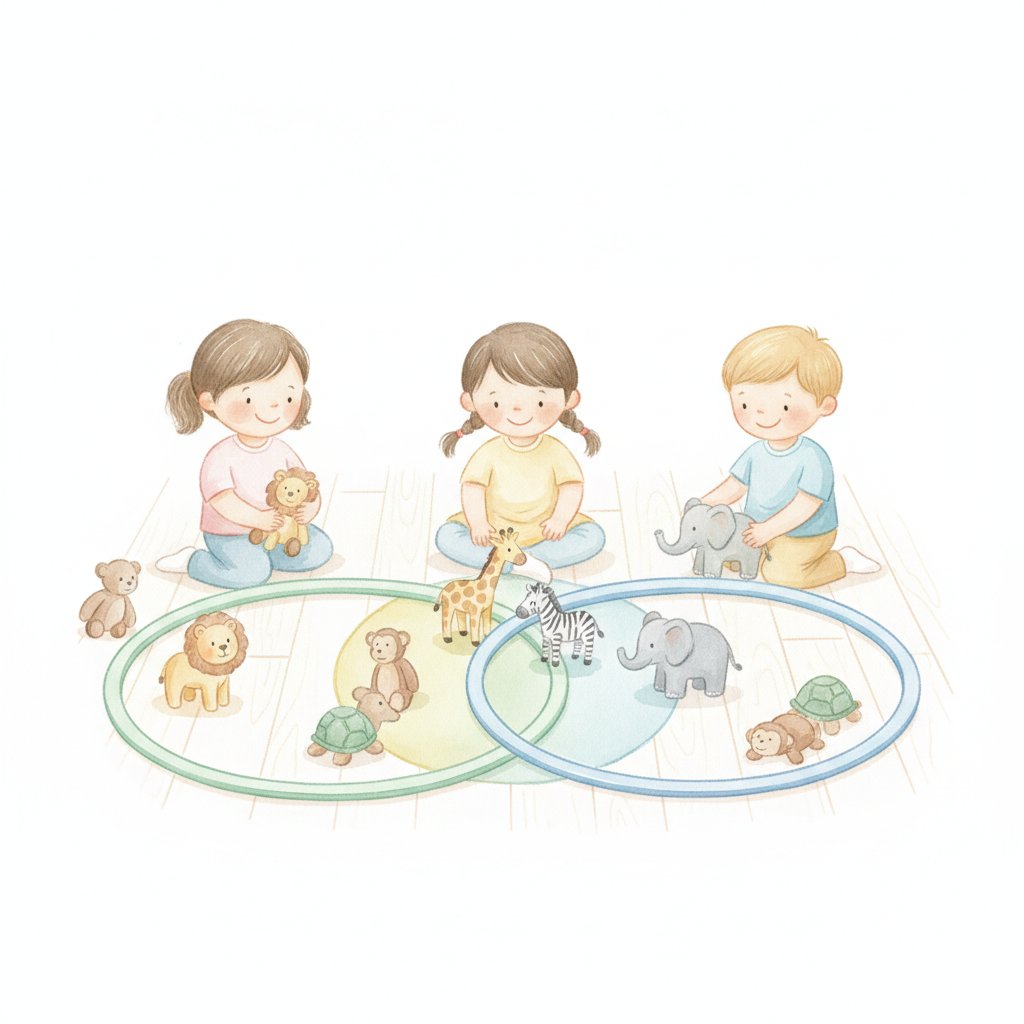
According to the National Council of Teachers of Mathematics, data activities teach categorization, counting, comparison (more, less, most, fewest), representation (using symbols for real things), and interpretation (reading conclusions from data). These are foundational math skills that children use throughout school and life.

This guide covers 20+ graphing and data activities for ages 3-6. Pair it with our number guide for counting and our sorting guide for categorization.

Picture Graph Activities (Ages 3-6)

1. Favorite fruit graph
Materials: Chart paper, fruit stickers.

What to do: "Put your sticker in the column for your favorite fruit. Which column is TALLEST? Which is SHORTEST? How many MORE people like grapes than bananas?" The graph teaches data collection and comparison. For more counting, see our number guide.

Why it works: Graphing is powerful for preschoolers because it makes COUNTING VISIBLE. When children put stickers in columns, they can SEE that 10 is taller than 6. They don't need to know the number symbols yet — the HEIGHT of the column IS the number. This visual representation bridges the gap between counting (a skill) and comparing quantities (a concept). The graph makes the abstract concrete.

2. Favorite color graph
Materials: Colored stickers, chart.

What to do: "Which color is your favorite? Put your sticker in that column! Which color wins?" The color graph connects to color vocabulary. For more colors, see our color guide.

3. Weather graph
Materials: Weather symbols, calendar grid.

What to do: "Every day, put a sun, cloud, rain, or snow symbol on the graph. At the end of the month, count: how many sunny days? How many rainy?" The weather graph teaches daily data collection. For more weather, see our weather guide.

4. Lunch choice graph
Materials: Name cards, lunch options.

What to do: "Put your name card under your lunch choice: hot lunch or cold lunch. Count: how many hot? How many cold?" The lunch graph teaches real-world data the school cafeteria actually uses.

5. Transportation graph
Materials: Transportation pictures.

What to do: "How did you get to school today? Car, bus, walk, bike? Put your name in the right column!" The transportation graph connects daily life to data. For more vehicles, see our transportation guide.

Colors make the best graphs
Our Colors Flashcards become graph column headers: 'Put the RED card at the top of column one. ORANGE at the top of column two. YELLOW at column three. Now sort your collection by color and stack them in the right columns!' Children sort objects by color, place them in columns under the matching flashcard, and instantly see a bar graph. 'RED has the MOST! Orange has the LEAST!' The flashcards are the labels; the objects are the data; the columns are the graph. No printing, no worksheets — just cards, objects, and mathematical thinking. Eleven colors, eleven columns, one living graph.

Tally and Survey Activities (Ages 3-6)

6. Tally marks counting
Materials: Paper, pencil.

What to do: "Every time you hear a bird chirp, make a tally mark: 1, 2, 3, 4, and the fifth one CROSSES the group. That's a bundle of 5!" The tally teaches counting by 5s. For more counting, see our number guide.

7. Favorite animal survey
Materials: Clipboard, paper.

What to do: "Ask 10 friends: 'What is your favorite animal?' Make a tally mark for each answer. Which animal got the MOST votes?" The survey teaches data collection through social interaction. For more animals, see our pets guide.

8. Yes or no vote
Materials: Two columns.

What to do: "Should we have recess before or after snack? Vote! Put your name in the YES column or the NO column. Count: which has more?" The vote teaches democratic decision-making through data. For more social skills, see our social skills guide.

9. Shoe type survey
Materials: Chart.

What to do: "What kind of shoes are you wearing? Sneakers, sandals, boots, or other? Let's see which type is most common!" The shoe survey teaches observation-based data collection.

10. Eye color tally
Materials: Mirror, tally sheet.

What to do: "Look in the mirror. What color are your eyes? Brown, blue, green, or hazel? Let's tally the whole class!" The eye color tally teaches self-observation and categorization. For more body, see our body parts guide.

Weather cards are a month-long data set
Our Weather Flashcards become a daily graph: 'Every morning, pick the weather card that matches TODAY. Put it in the column. After 30 days, count: Sunny was 12 days. Cloudy was 8 days. Rainy was 6 days. Snowy was 4 days. Sunny wins!' The flashcards are the data points. The wall is the graph. The month is the timeframe. Children collect real data every day and watch their graph grow. By the end of the month, they can READ the graph: 'Which weather was most common? Least common? How many more sunny days than snowy days?' Twelve weather cards, thirty data points, one month of math.

Bar and Comparison Activities (Ages 3-6)

11. Block bar graph
Materials: Unit blocks.

What to do: "Stack blocks to show how many: 5 people like dogs, 3 like cats, 7 like fish. Build the TOWERS. Which is tallest?" The block graph makes bar graphs physical and 3D. For more blocks, see our block guide.

12. More, less, equal
Materials: Any graph.

What to do: "Look at this graph. Which has MORE? Which has LESS? Are any EQUAL? How many MORE does the tallest have than the shortest?" The comparison teaches mathematical vocabulary. For more comparison, see our opposites guide.

13. Snack graph comparison
Materials: Two snacks, two groups.

What to do: "Half the class got crackers, half got pretzels. Graph who ate ALL, SOME, or NONE of their snack. Did cracker kids eat more or pretzel kids?" The snack graph teaches comparison through real consumption data. For more nutrition, see our nutrition guide.

14. Growth graph
Materials: Height measurements.

What to do: "We measured everyone's height in September and in May. Let's graph BOTH. How much did each person grow? Whose bar got taller?" The growth graph teaches change over time through personal data. For more measurement, see our measurement guide.

15. Dice roll graph
Materials: Die, graph with numbers 1-6.

What to do: "Roll the die. Put a sticker in the column for the number you rolled. Roll 20 times! Which number got the MOST rolls?" The dice graph teaches probability and randomness. For more number games, see our number guide.

More Data Activities (Ages 3-6)

16. Venn diagram with hoops
Materials: Two hula hoops, objects.

What to do: "Sort these animals: FARM animals in this hoop, animals that FLY in this hoop. What about a chicken? It goes in BOTH — that's the MIDDLE!" The Venn teaches overlapping categories. For more sorting, see our sorting guide.

17. Feelings graph
Materials: Emotion faces, name tags.

What to do: "How are you feeling today? Happy, sad, excited, tired, angry? Put your name under the face. Look at our graph — most people are HAPPY today!" The feelings graph teaches emotional awareness through data. For more feelings, see our feelings guide.

18. Birthday month graph
Materials: Month labels, name tags.

What to do: "Put your name under your birthday month. Which month has the MOST birthdays? Which has the LEAST? Are any empty?" The birthday graph teaches months and calendar data. For more time, see our seasonal guide.

19. Pet survey graph
Materials: Survey sheet.

What to do: "Who has a pet? Dog, cat, fish, bird, hamster, or none? Graph the results!" The pet survey teaches data collection about things children care about. For more pets, see our pets guide.

20. Graph of graphs
Materials: All the graphs you've made.

What to do: "Look at ALL our graphs this month! Which graph had the BIGGEST difference between most and least? Which was closest to EQUAL? What did we learn from our data?" The meta-analysis teaches that data tells stories over time. For more thinking skills, see our problem-solving guide.

Graph your shapes
Our Shapes Flashcards become a shape hunt graph: 'Take the triangle card, the square card, the circle card, and the rectangle card. Tape them to the wall as graph headers. Now walk around the room and find objects: a clock is a CIRCLE — put a tally mark under the circle card. A book is a RECTANGLE — tally under the rectangle. A window is a SQUARE — tally under the square.' After 10 minutes, read the graph: 'Circles have 8! Rectangles have 12! Why are there more rectangles? Because books, doors, papers, and screens are ALL rectangles!' The flashcards organize the hunt; the graph reveals the pattern. Twelve shapes, one room, infinite data.
1.Is graphing too advanced for preschoolers?
Not at all. Preschoolers can create and read PICTURE graphs (using real objects or stickers), understand MORE and LESS by comparing column heights, answer questions about their data ("Which has the most?"), and make simple conclusions ("More people like dogs than cats"). The key is using CONCRETE materials (stickers, blocks, name cards) rather than abstract numbers. Standard bar graphs with numbered axes come later, but the THINKING — comparing, counting, concluding — starts at age 3.
2.How often should we do graphing activities?
Daily mini-graphs (weather, lunch choice, how-you-feel) take 2-3 minutes and build graph literacy through routine. Weekly bigger graphs (favorite animal survey, snack comparison, classroom vote) take 10-15 minutes and go deeper. The daily graphs build the HABIT of thinking in data; the weekly graphs build the SKILL of data analysis. Both are needed. Many classrooms have a permanent "graph of the day" board that becomes as routine as calendar time.
3.What makes a good preschool graph question?
Good questions are about things children CARE about: favorite foods, pets, colors, games, weather, holidays, superheroes, animals. Bad questions are abstract or disconnected from their lives. The data must be REAL and PERSONAL — not made up. "How many siblings do you have?" is better than "How many apples are in this worksheet?" Real data from real children creates real engagement.
4.How do I connect graphing to other subjects?
Science: graph weather, plant growth, sink/float results. Social studies: graph family size, transportation, holidays. Literacy: graph favorite books, letter sounds, rhyming words. Art: graph favorite colors, materials used. Physical education: graph activities, heart rates, distances jumped. Graphing is a CROSS-CUTTING skill that makes every subject more mathematical. Any question that produces categories can become a graph.